Design Intel
How I eliminated 20+ hours of manual reporting and caught burnout before it happened
20+hrs/mo
Manual Reporting Eliminated
12
Designers Protected
4
Systems Unified
Zero
Self-Reporting Required
The Problem
Every Monday I spent two hours pulling data from four different places. Figma for the work. Asana for the tickets. Spreadsheets for capacity. Slack for the fires nobody logged anywhere.
By the time I stitched it all together, the picture was already wrong. Someone picked up a rush project. A client added three rounds of revisions to a scope that was supposed to be final. A designer who looked fine on paper was drowning, and the spreadsheet couldn't tell me that.
I lead 12 designers across 60+ brands. My job is to see the problems coming before they land. But the tools we had made me blind until it was too late. Five-plus hours a week, just to build a snapshot that was stale before I finished it.
Leadership wanted visibility. The team needed someone watching out for overload. And I needed to stop being the bottleneck between the data and the decisions.
The Approach
I stopped trying to fix the reporting process and built a new one.
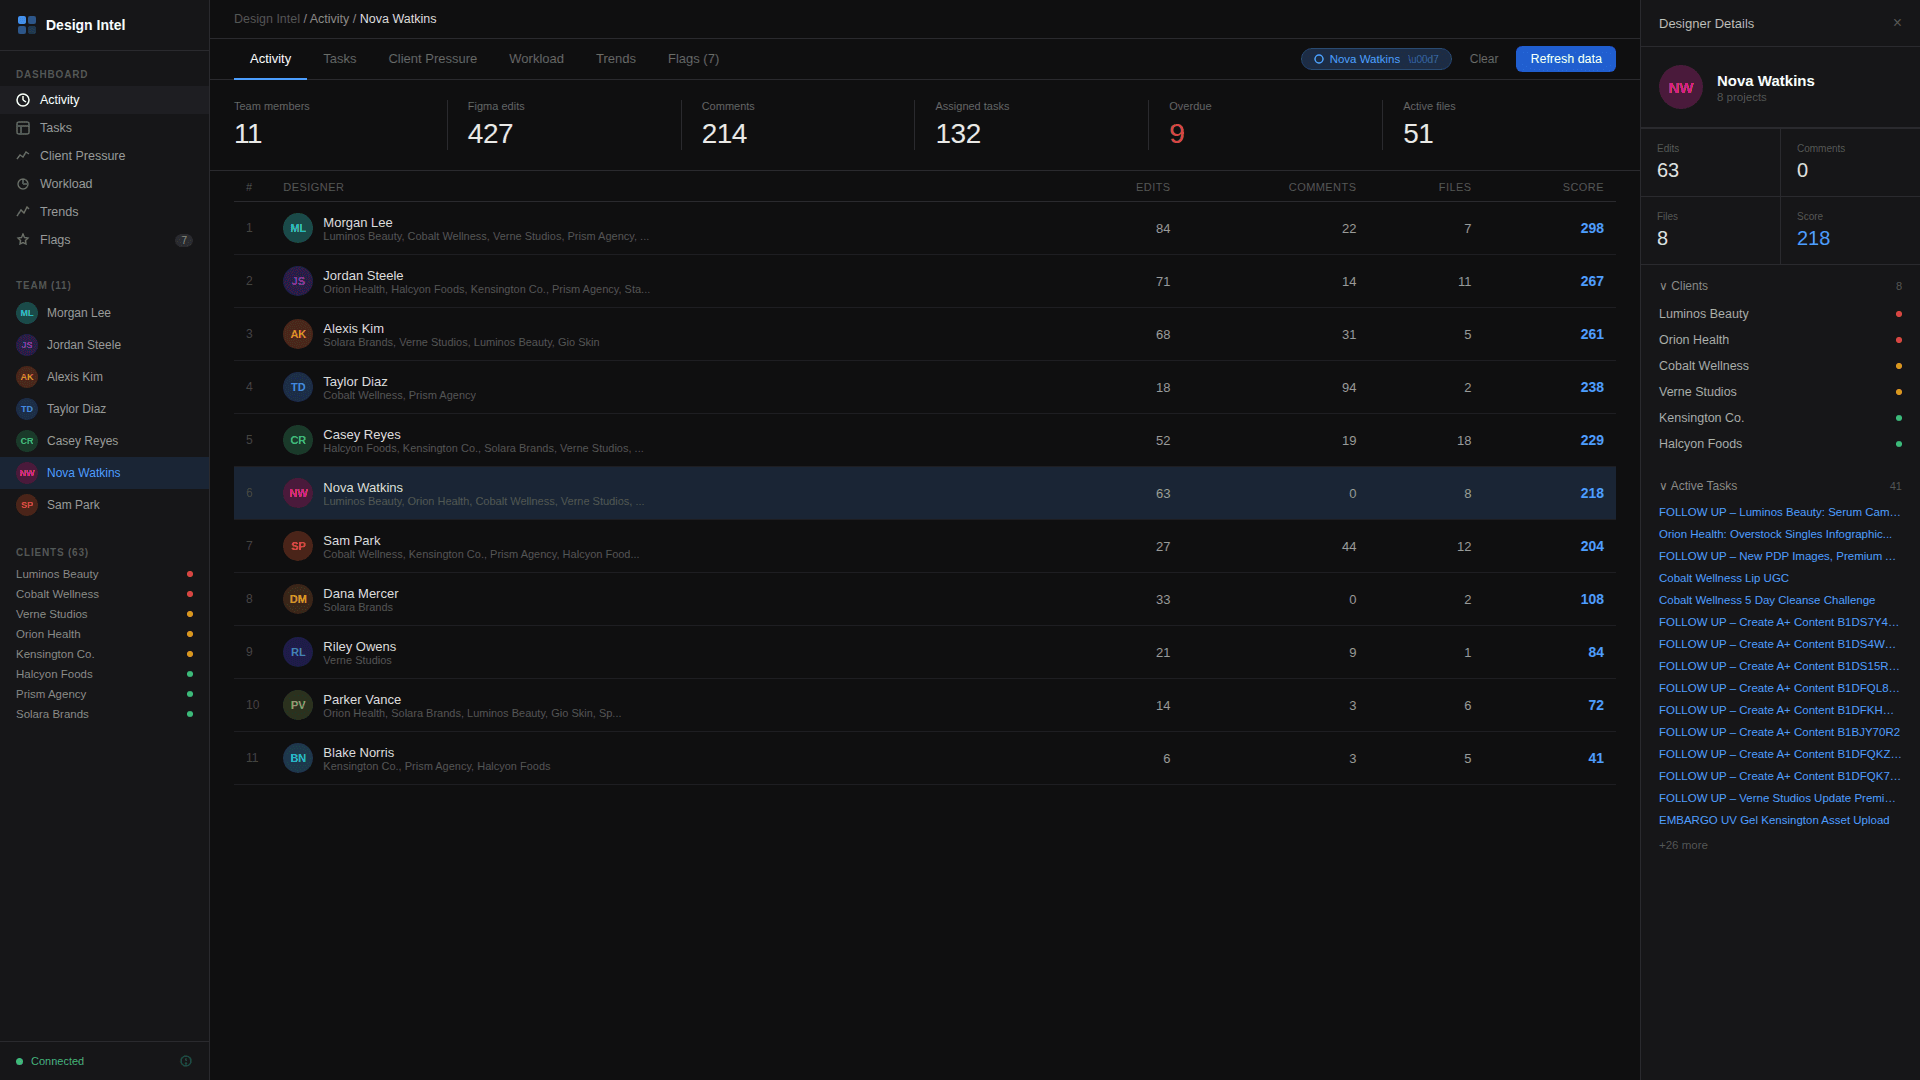
Design Intel is a single dashboard that pulls live data from Figma, Asana, and internal systems. It shows who's overloaded, which clients are generating the most pressure, and where delivery timelines are at risk. All of it updates in real time.
The stack is Next.js, TypeScript, and Vercel. Claude handles the analysis layer, finding patterns in the workload data that a human would miss. Things like a designer whose revision count tripled in two weeks, or a client whose scope creep pattern matches one that caused a missed deadline last quarter.
Getting buy-in was the first challenge. I pitched leadership and project management on the concept and worked with them to define what visibility they actually needed. The dashboard was shaped around those conversations. A tool that served the people making resourcing decisions, not just the person pulling the data.
The harder conversation was with the design team. A dashboard that tracks workload and flags burnout could easily feel like surveillance. I was transparent about what it tracked, what it didn't, and why. Designers see their own data. Nothing is hidden. The tool exists to protect them, not monitor them. That framing mattered. Adoption came from trust, not mandate.
I designed it to feel like something designers would actually open. If it doesn't feel as clean as working in Figma, nobody's going to use it.
What It Does
Workload Visibility
Shows exactly who's at capacity, who has room, and who's been quietly absorbing work that isn't on their plate. No more guessing from Asana ticket counts.
Client Pressure Mapping
Tracks the signals that predict problems. Revision cycles speeding up. Turnaround windows shrinking. Scope expanding without timeline adjustments. You see it building before it breaks.
Delivery Metrics
Output tracking pulled directly from Figma activity and Asana completion data. Leadership gets the numbers without designers filling out status reports.
AI-Powered Analysis
Claude runs pattern analysis across all four data sources and flags what's coming. Burnout trajectories. Lopsided workload distribution. Delivery risks that aren't obvious yet.
The Impact
Twenty-plus hours of manual reporting, gone. Every month. That alone would justify the build. Those hours turned into capacity the team could reinvest into actual design work, letting us scale output across more brands without adding headcount.
But the real value is in what didn't happen. The burnout that got caught at the overload stage. The client escalation that got flagged as a pattern before it became an emergency. The capacity gap that showed up in the data three weeks before anyone would have noticed it in a standup.
The biggest shift was in how leadership talks to the design team. They stopped asking "how's everyone doing?" and getting a polite "fine." Now they open Design Intel, see the real picture, and come to the conversation with specific questions about resourcing and tradeoffs. That's the difference between managing a team and actually leading one.
Want to talk about design ops or AI-powered tooling?
Get in touch